
Introduction
X-ray induced acoustic imaging is potentially solution for in vivo dosimetry and real-time monitoring of beam position and online assessment of delivering dose during radiation therapy. Pulsed radiation beam produced by Linacs generates transient temperature rise in tissue after being absorbed, similar to photoacoustic imaging (PAI), the acoustic waves induced by the high-energy X-rays, namely X-ray acoustic (XA) wave, could be detected by ultrasonic transducers. Our work aims to examine the feasibility of XACT for dosimetry and real-time monitoring, including the relative radiation dose delivered to the target region and the dose delivery position in relation to the target tissue.
A prototype XACT system, which had an immersion ultrasound transducer scanning around target sample, was used to acquire XA signals produced by a medical linear accelerator to form an XA image of irradiated phantom. Current study evaluates the feasibility of obtaining relative dose distribution in radiotherapy by performing XACT imaging of soft-tissue phantoms. The study has shown that XACT images of soft-tissue phantoms can be achieved with accuracy in dose measurement of up to 2.9% at a spatial resolution of 6 mm, which suggests the potential application of XACT imaging for verifying beam alignment with the target tissue and for evaluating accuracy of the dose delivered to the target tissue. Combining XACT imaging with clinical US imaging is a novel in vivo dosimetry approach that has the potential to guide radiotherapy delivery in real time.

Fig.1 (A) Schematic of the XACT system. (B) Photograph of the instruments inside the treatment room. Trans.: transducer; DAQ: data acquisition card.
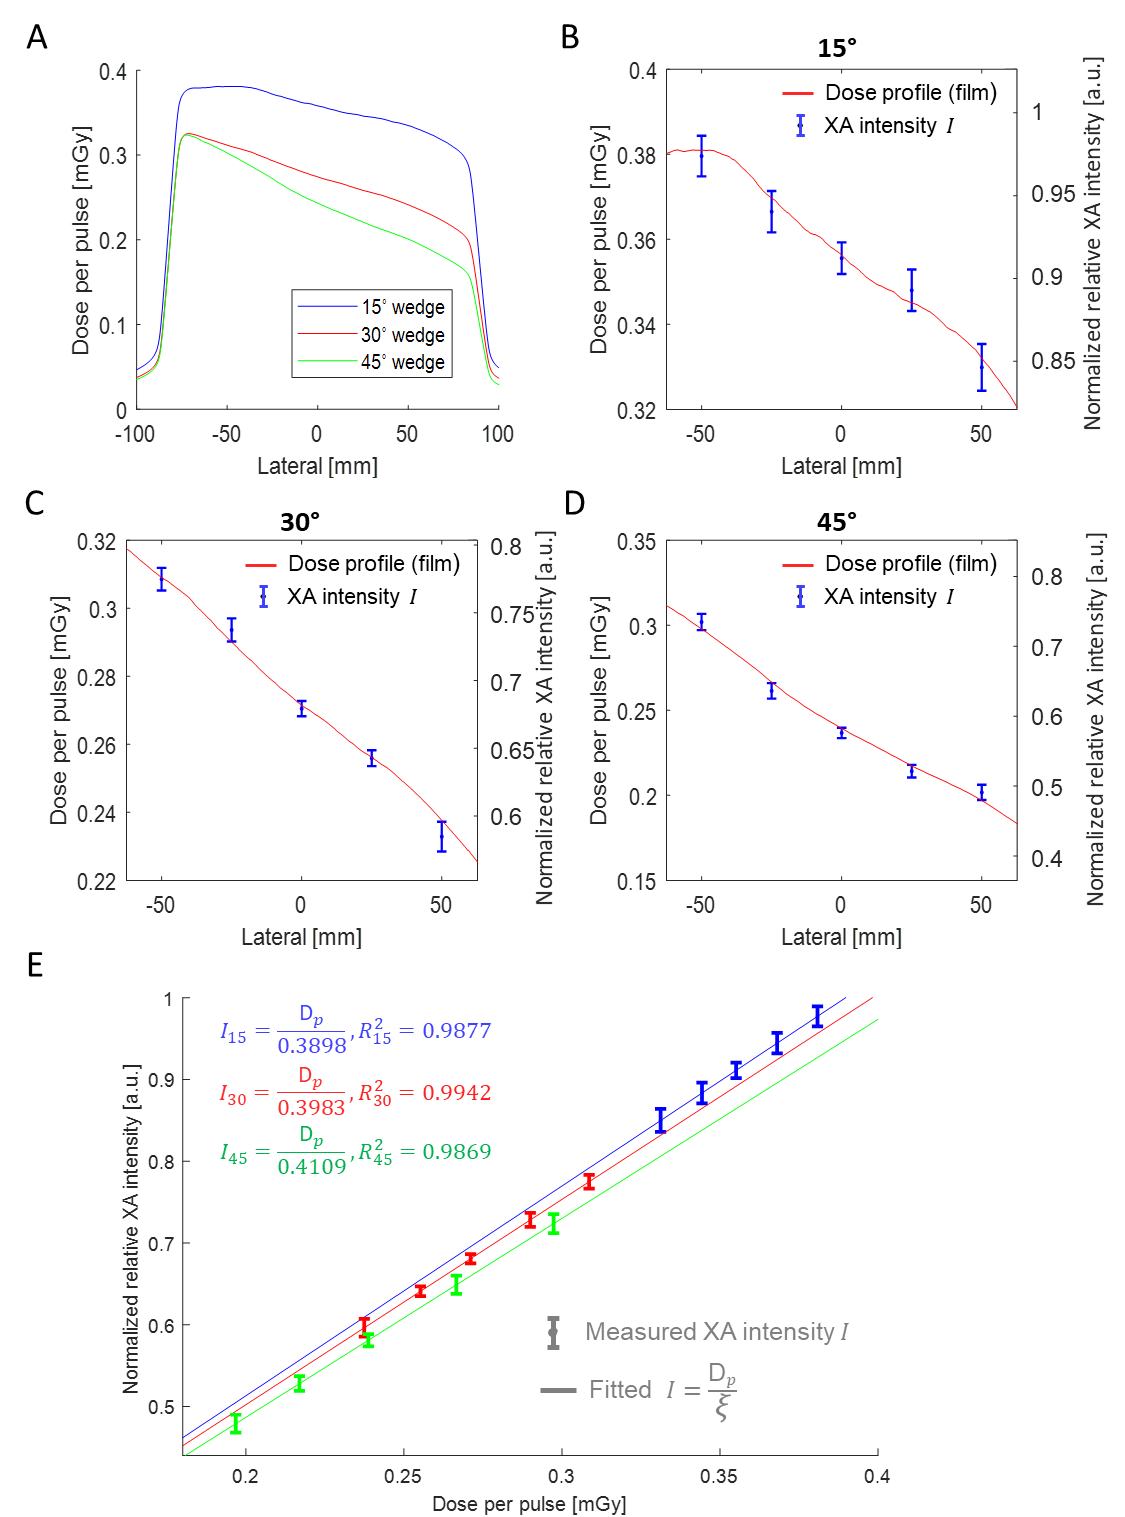
Fig.2 (A) Dose profiles extracted from the film test results for three physical wedges (15°, 30°, and 45°). (B)-(D) Dose per pulse extracted from film profiles shown in (A) matched with the mean value and standard deviation of the normalized relative XA intensities (shown in Fig. 8) under the 15°, 30°, and 45° physical wedges, respectively. (E) Correlation between the normalized relative XA intensity and the film measured dose per pulse, including linear fittings for the 15°, 30°, and 45° physical wedges (shown in blue, red, and green, respectively).
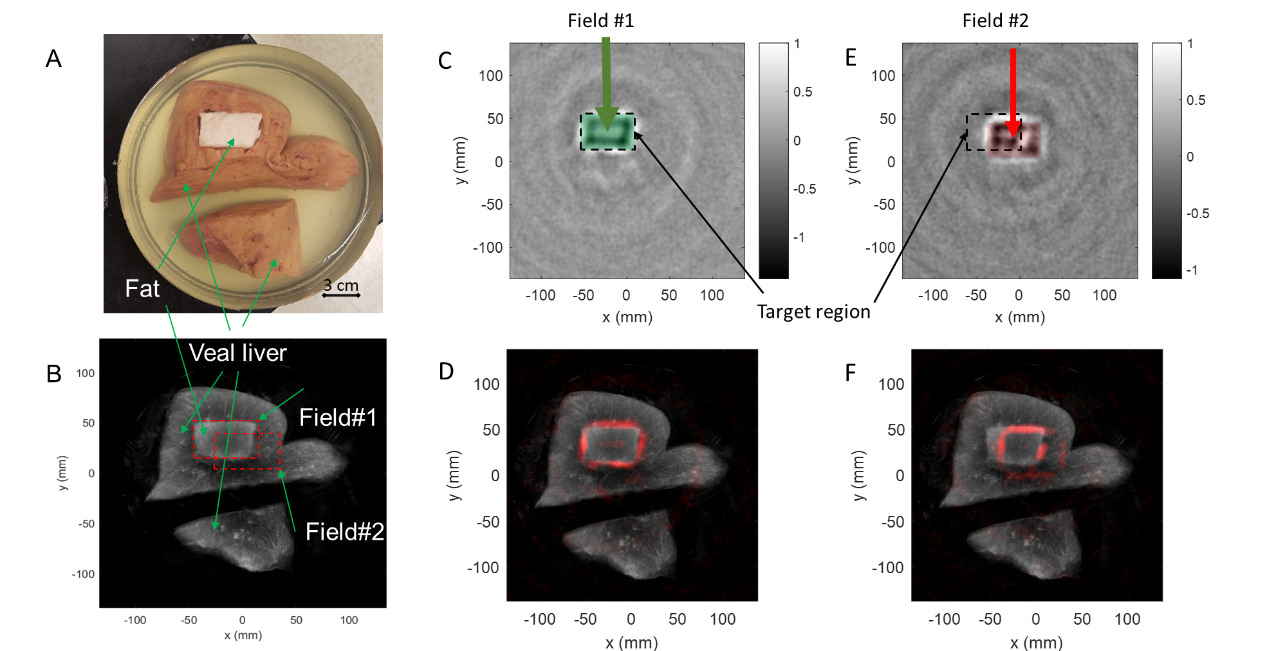
Fig.3 (A) Photograph of a porcine gel phantom containing veal livers and fat. (B) Compounding US image of the phantom, where the shape and the location of the radiation X-ray beam are labeled by a red dash rectangle (6 cm×4 cm). Field #1: the beam was aligned to the fat cuboid (i.e., target of treatment); Field #2: the beam was shifted away from the target (20 mm along the x-axis and -10 mm along the y-axis). Normalized XACT images corresponding to (C) Field #1 (radiation beam on-target) and (E) Field #2 (radiation beam off-target). The dashed rectangle marks the position and the shape of the target. (D) XACT image in (C) presented in pseudo color and superimposed on the gray scale US image of the phantom. (F) XACT image in (E) presented in pseudo color and superimposed on the gray scale US image of the phantom.