
Introduction:
Almost all of the studies in photoacoustic (PA) imaging have been focused on the intensity of the PA signals as an indication of the optical absorbance of biological tissues. Our group has demonstrated that the frequency domain power distribution of the broadband PA signals also encodes the texture information within the regions-of-interest (ROIs). Similar to ultrasound (US) spectrum analysis, PA spectrum analysis (PASA) could evaluate the intensity and, more importantly, the “pitch” or frequencies of the PA signals. Through a study on mouse model, we have validated the capability of PASA in identifying the microstructure changes corresponding to fat accumulation in livers for the purposes of fatty liver diagnosis. In the study on phantoms, we have demonstrated the close correlation between the PA spectral parameters and the physical properties of the optical absorbers in a tissue.
These studies suggest that PASA offers fundamental advantages for addressing a number of practical problems faced by PA imaging. 1) PASA separates the effects from system components and tissue properties on image features and delivers system-independent quantitative results. 2) Averaged power spectra provide a cogent means of addressing the stochastic nature of tissue microstructure and lead to measurements that are quantitative and repeatable. 3) The capability of operating at relatively low frequencies avoids the high cost and limited imaging depth associated with high-frequency PA imaging systems.
Example results:
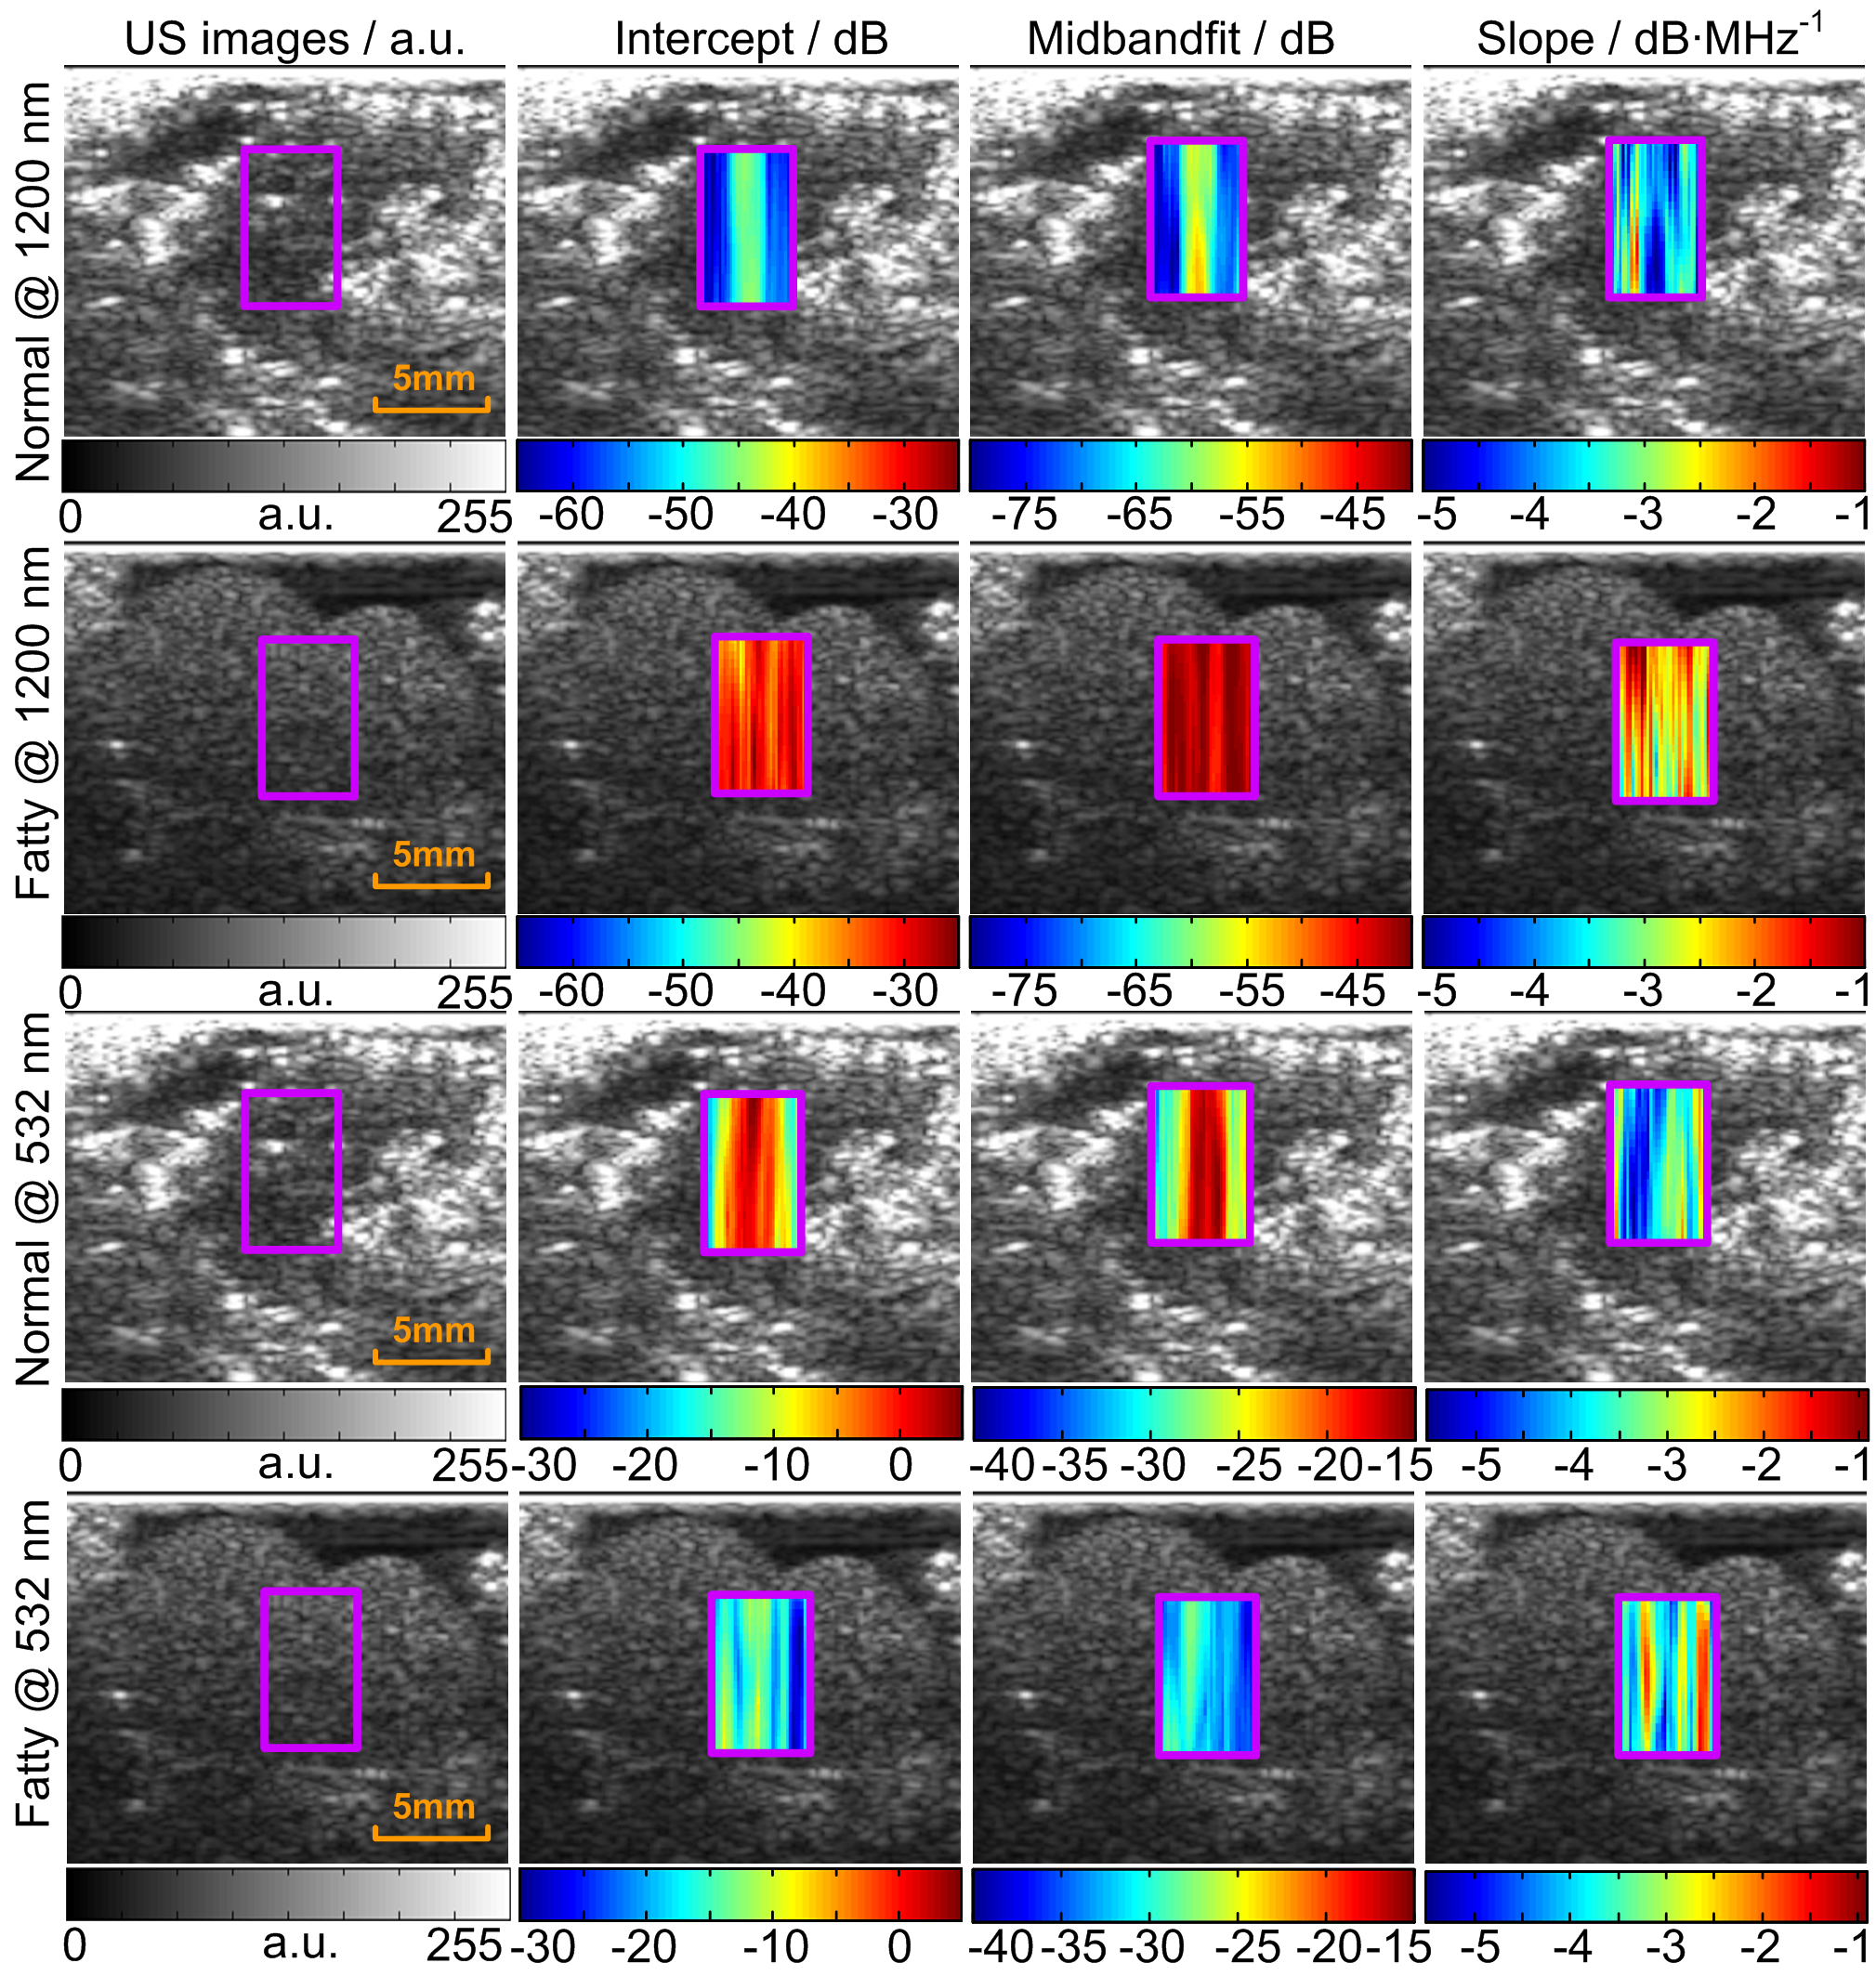
Column 1 shows the US images from the fatty liver and the normal liver in a mouse model and the region of interests (ROIs) to be analyzed by PASA, as marked by the magenta boxes. The columns 2, 3 and 4 demonstrate the intercept, the midband-fit and the slope values within the ROIs superimposed on the US images. PASA results at 1200 nm (strong lipid signal) and 532 nm (strong blood signal) are presented. The parameter distributions are calculated at each step of the sliding window in Pwelch algorithm. At 1200 nm, the PASA parameters including the intercept, the midband-fit and the slope of the normal tissue are smaller than those of the fatty ones. At 532 nm, the intercept, the midband-fit values of the normal tissue are larger than those of the fatty ones.
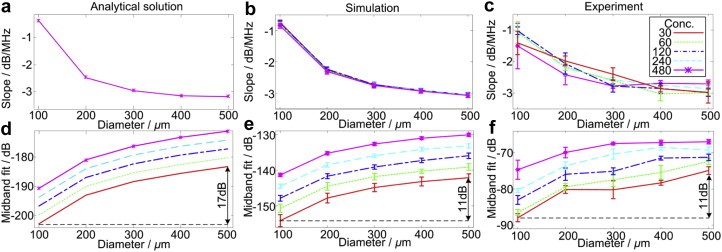
Variation trends of the photoacoustic spectral parameter slope and midband-fit values with respect to the diameters and concentrations of the microspheres (spherical optical absorber in the gel phantom). The numbers in the legend are the numbers of microspheres per 1.53 cm3 volume. In (a), the curves for the concentrations overlap as the slope values do not vary with respect to the concentrations. (a)–(c) show comparable trends of slope variations with respect to the diameters of the microspheres. The variation ranges of the midband-fit values are annotated in (d)–(f). Conc. = concentration.