
Introduction:
The objective of this research is to develop a low-cost, minimally invasive, in vivo diagnostic and personalized therapeutic platform for prostate cancer. Photoacoustic imaging (PAI) enhanced by nanoparticle contrast agent may contribute to prostate cancer detection from the following aspects:
1) The actively targeting nanoparticles will trace to the origins of the enzymes at the surface of the cancer cells, and stain the tumors.
2) The stained tumors will be macroscopically delineated in transrectal PAI on top of the co-registered US images. The PA images will be acquired at a wavelength specific to the strong optical absorption of the dye loaded in the nanoparticles, assuring infinite contrast between the tumor and the surrounding tissue.
3) A needle photoacoustic probe can be inserted to the nanoparticle stained tumor by the identical mechanism for the biopsy needle insertion. The microscopic physical architecture within the tumor will be evaluated by photoacoustic spectral analysis through the needle probe in vivo for Gleason grading.
4) Once a high-grade cancer is identified, the illumination wavelength of the needle probe can be switched to activate the therapeutic drug to deploy immediate photo -thermal or -dynamic therapy (PTT/PDT) to the cancer cells. Feedback of the therapy can be instantaneously monitored by the transrectal photoacoustic and ultrasound system.
Example results:
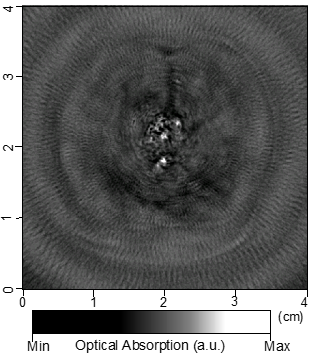

(Left) 2D photoacoustic image of a canine prostate taken at 700 nm. (Right) Specimen photograph of the imaged cross section in the prostate.
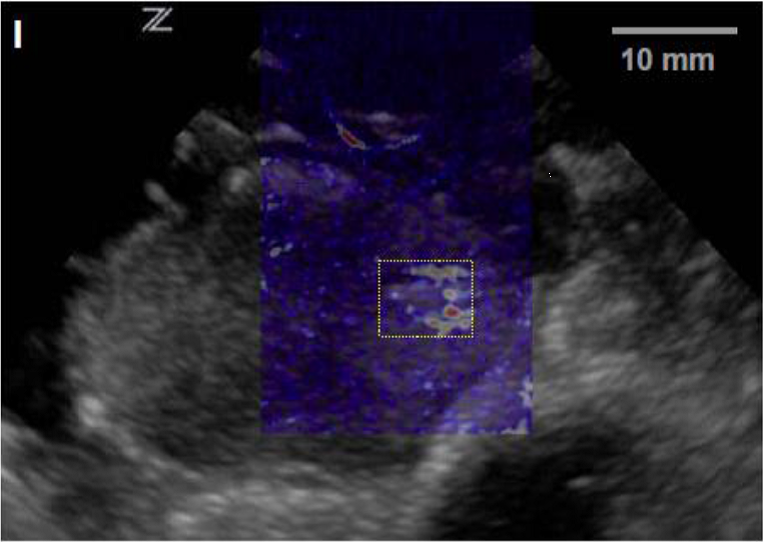
Ultrasound (in gray scale) and photoacoustic (in color scale) coregistered image of a canine prostate in vivo with a subsurface blood rich lesion (depth 15 mm). The bright region in the white box in the photoacoustic image indicates the lesion.
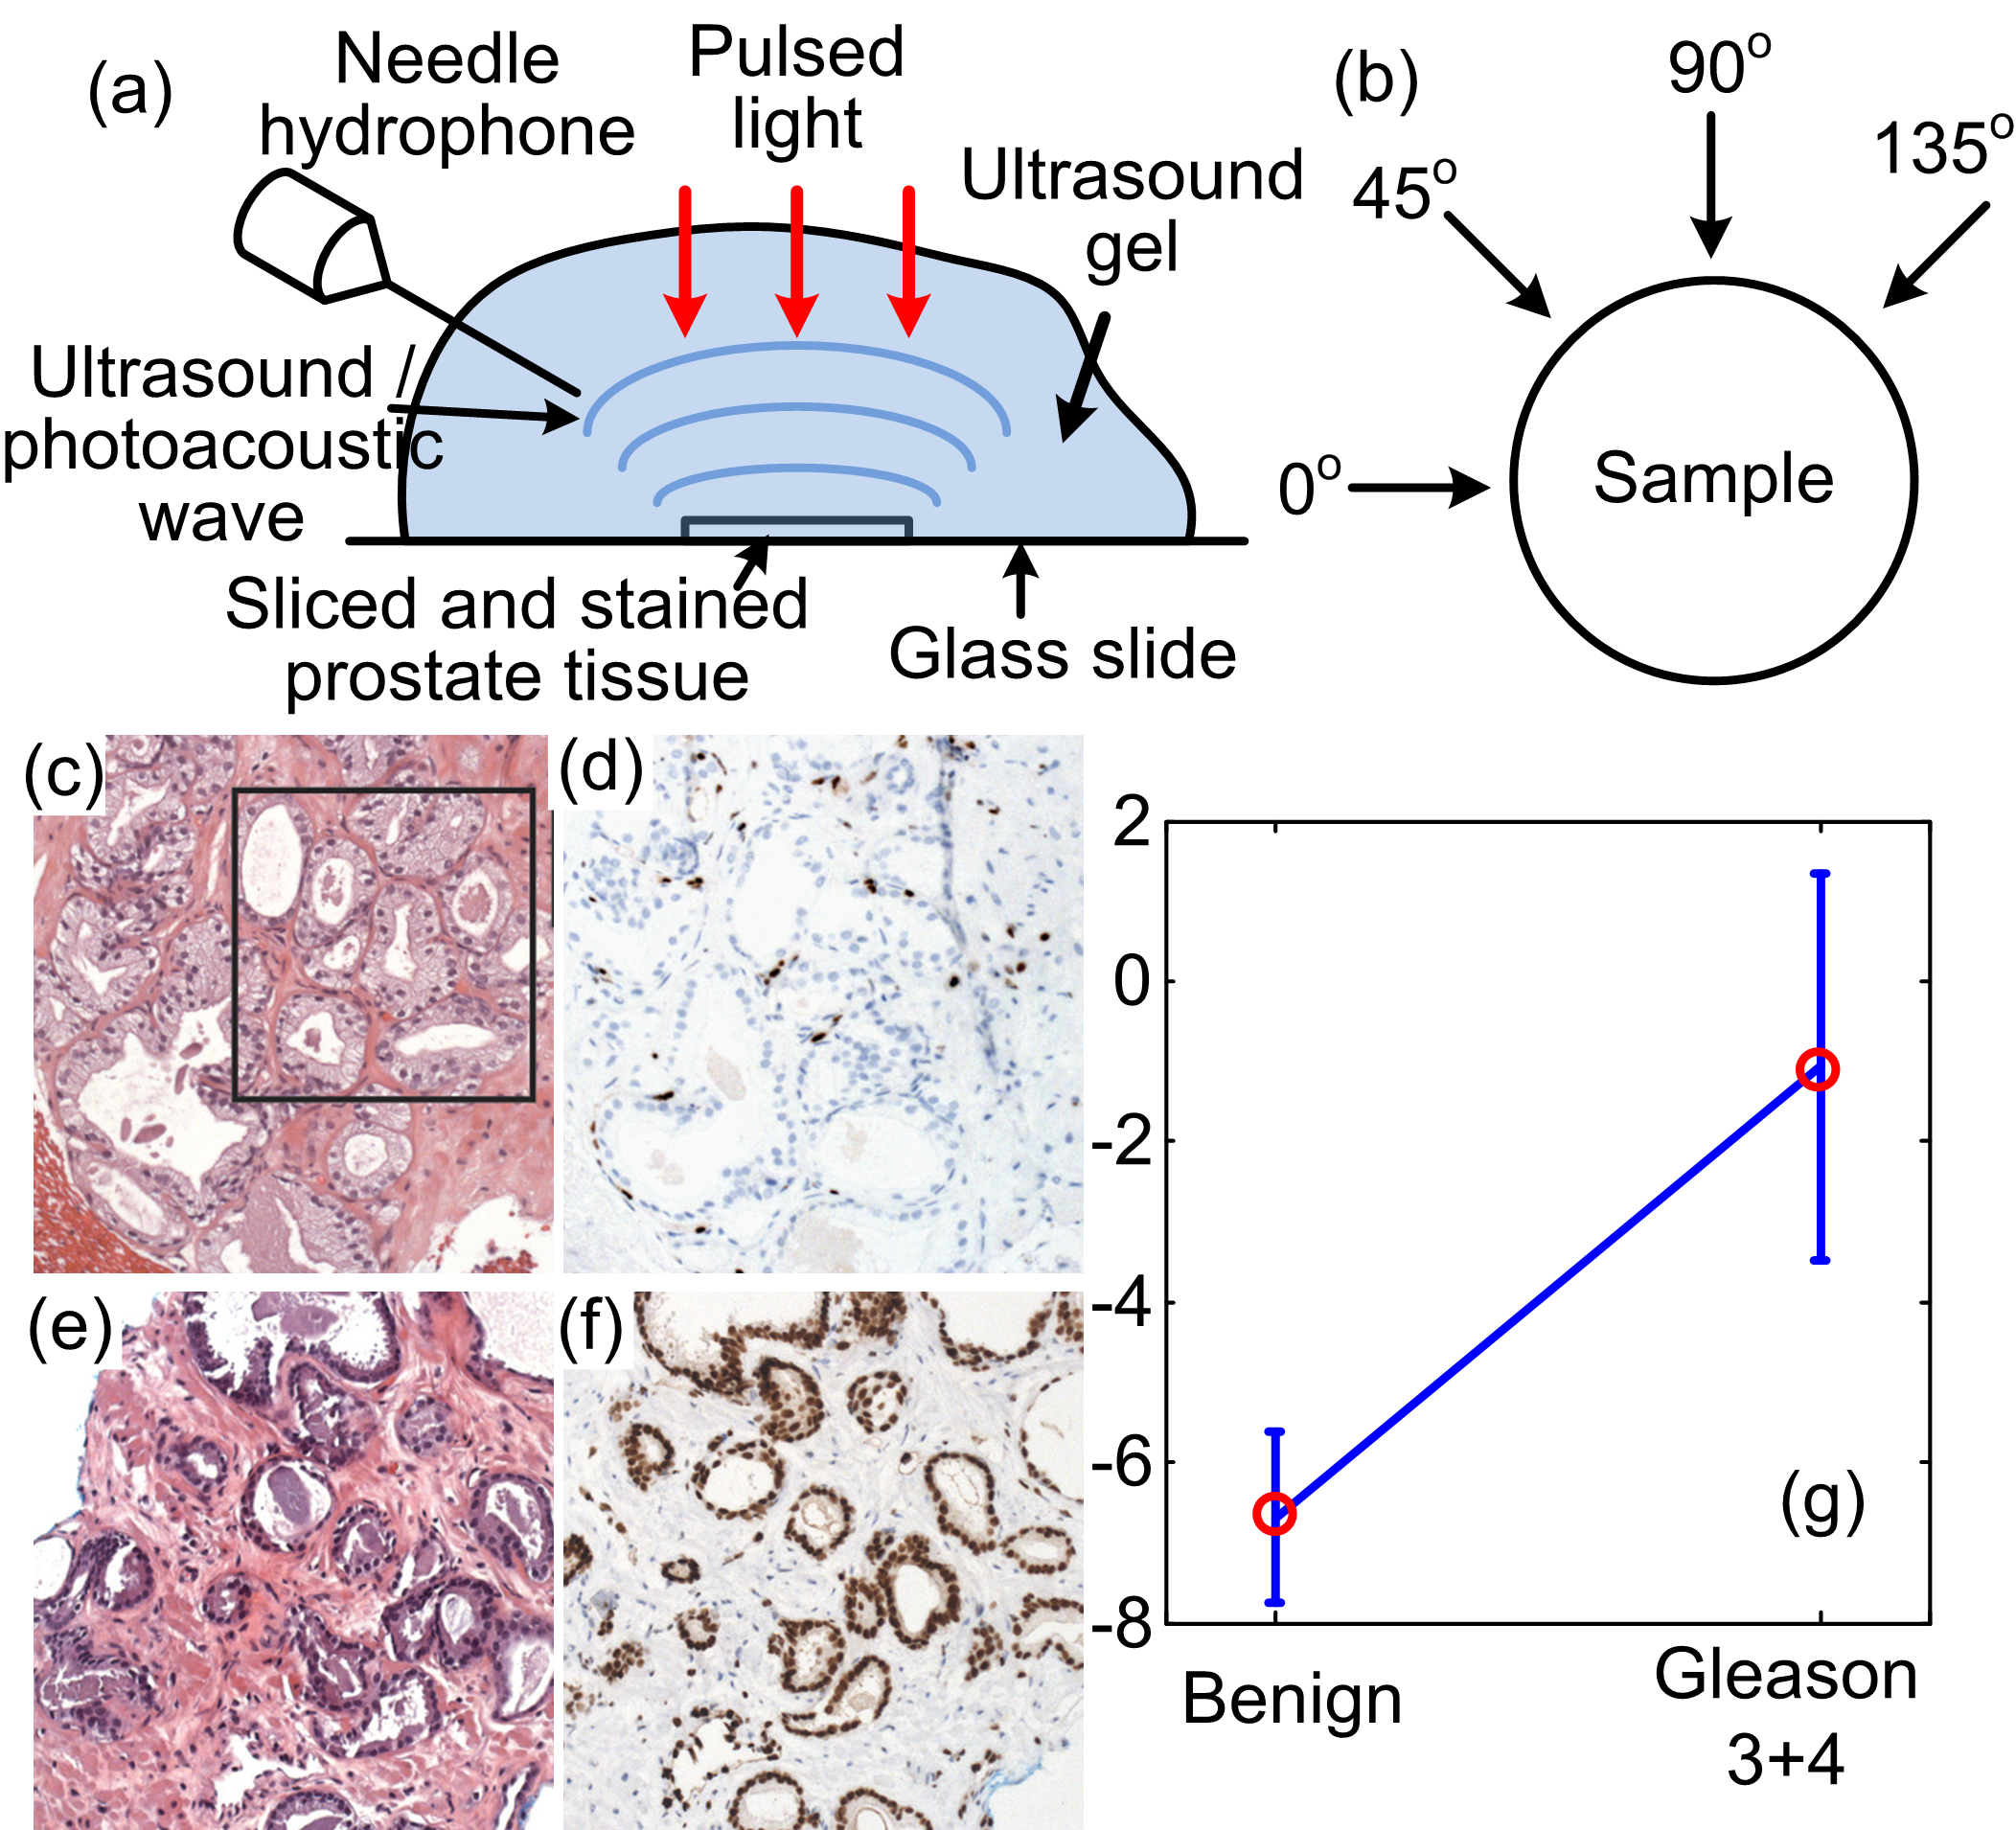
The feasibility of quantifying the Gleason patterns with needle-based photoacoustic measurement and spectral analysis was evaluated through an experiment on sliced and Hematoxylin and eosin (H&E) stained human prostate tissues. 5 normal and 5 cancerous human prostate tissues with Gleason score of 3+4 were scanned. The spectral parameter slopes quantified through photoacoustic spectral analysis (PASA) were averaged for each sample and then compensated by the portion of cancerous area considering the linearity of the slopes. In the statistics of the averaged slopes, we can see good separation between the normal group and the cancerous group, suggesting the capability of needle based photoacoustic measurement for prostate cancer diagnosis.